![]()
![]()
Well, this time you don't actually need an 'Intro' column because it has already been "said" in the technical review of NVIDIA GeForce FX 5900 Ultra (NV35) Graphics Adapter in the HARDWARE LABORATORY department on this site. So, first of all, it's recommended to read the technical review here. To know the details of the drivers setup (it's strongly recommended for you to know the exact video card configuration) for the video chip before seeing its tested in this department, read the article 'NVIDIA GeForce FX 5900 (NV35) Drivers Setup' in the SOFTWARE EXCLUSIVE department - here. After reading these articles, you are fully "equipped" with all the required knowledge for this benchmark testing.
First, let's take a look at the testing configuration.
![]()
![]() Processor - Intel Pentium 4 3066
MHz (HT=ON)
Processor - Intel Pentium 4 3066
MHz (HT=ON)
![]() Mainboard - ASUS P4G8X (iE7205)
Mainboard - ASUS P4G8X (iE7205)
![]() RAM Memory - 1024 MB DDR SDRAM Memory;
RAM Memory - 1024 MB DDR SDRAM Memory;
![]() Hard Drive - Seagate Barracuda IV 40GB;
Hard Drive - Seagate Barracuda IV 40GB;
![]() Software Environment - Windows XP SP1;
DirectX 9.0a.
Software Environment - Windows XP SP1;
DirectX 9.0a.
![]() Monitors -
Monitors -
![]() Drivers Configuration - NVIDIA Detonator FX
44.03 (VSync - off, textures compression in applications - off)
Drivers Configuration - NVIDIA Detonator FX
44.03 (VSync - off, textures compression in applications - off)
The following video chips' results are provided for a comparison analysis:
![]() Reference card NVIDIA GeForce FX 5800 Ultra
(500/500 (1000 DDR) MHz, 128 MB)
Reference card NVIDIA GeForce FX 5800 Ultra
(500/500 (1000 DDR) MHz, 128 MB)
![]() ATI RADEON 9800 PRO (380/340 (680 DDR) MHz, 128 MB, driver
6.307)
ATI RADEON 9800 PRO (380/340 (680 DDR) MHz, 128 MB, driver
6.307)
2D Graphics
Results in this kind of benchmarks usually don't depend on the declared characteristics of the specific chip ! In addition, there sometimes can be a problem with compatibility of a specific monitor and a video card. So the '2D Graphics' testing is visual. 2D Graphics was tested on a ViewSonic P817-E monitor with the Bargo BNC-cable. And it should be admitted that the video chip showed fantastic results! Even in 1600§1200x85Hz and 1280§1024x120Hz everything went very well.
RightMark 3D Synthetic Benchmarks
RightMark3D is a non-commercial non-limited project available for development for anyone interested ! The beta version of the best benchmarks is available for download at http://www.rightmark3d.org/d3drmsyn/ - the official site of RightMark3D. At all the following benchmarks were chosen for testing:
![]() Pixel Filling Test
Pixel Filling Test
![]() Geometry Processing
Speed Test
Geometry Processing
Speed Test
![]() Hidden Surface Removal Test
Hidden Surface Removal Test
![]() Pixel Shading
Test
Pixel Shading
Test
![]() Point Sprites Test
Point Sprites Test
This is a basic Pixel Fillrate benchmark.
Constant color filling - texture fetching is not processed. Results are
given in million texels per second in different resolutions in the normal
mode as well as in 4§ MSAA mode:

Filling rate difference in the antialiasing-off mode equals the difference of frequency rates of NVIDIA GeForce FX 5900 Ultra and NVIDIA GeForce FX 5800 Ultra (450 MHz vs 500 MHz). In spite of the higher frequencies of GeForce FX - GeForce FX 5900 Ultra ATI Radeon chip wins in all of the modes (of an antialiasing-off kind). This actually means that the system bus frequency doesn't limit the performance of GeForce FX graphics adapters, ATI Radeon chip wins only because of having 8 (!) conveyor pixel processors of rendering (compare it with only 4 on GeForce FX) that allows to process 8 full pixel blocks per clock. But unlike GeForce FX, ATI chips performance is limited by the system bus frequency. GeForce FX can process only 4 full pixels (color + depth + stencil buffer). But if the color value remains unchanged during the rendering, each pixel processor releases 2 results, thus, filling 2 pixel blocks per clock (2x4=8 pixel blocks in total). This technology (by the way, it was declared by NVIDIA as a part of the UltraShadow technology) would be useful and allow a noticeable performance increase in games that use stencil buffer and shadows much (for example, DOOM III). But in this test, Color+Z rendering is used, so only 4 pixel blocks are processed per clock by GeForce FX 5900.
Now about the antialiasing-on mode. "Everything's changing" now. GeForce FX 5900 is much better than GeForce 5800 and of course, beyond any comparison with ATI chip. The difference is growing when increasing the resolution (and that's with having only 4 pixel conveyors). I think the main factor of benefit here is because of the 256-bit local memory bus used.
The second sub-benchmark is a pixel filling
with the simultaneous simple texture processing. So a simple bilinear
texture processing is added now. Results are given in the same
read-format. ATI Radeon chip results are not given because they seemed
to be very strange and manifestly understated (the problem is in the 3.1
version of ATI Catalyst graphics drivers).
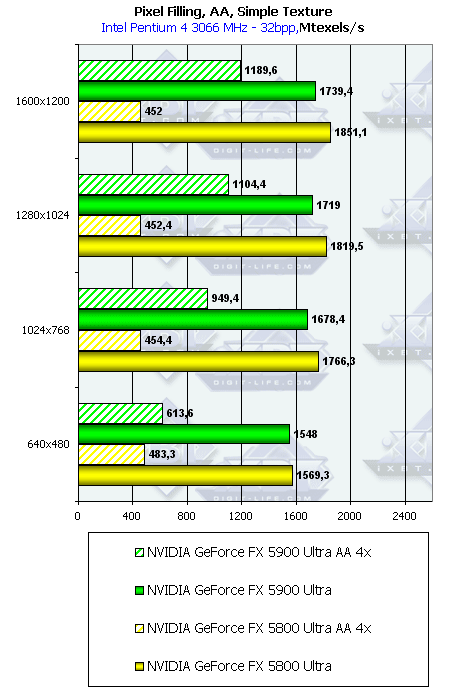
I decided to group these results by their kind
in the table below:
| Video Chip | Theoretical maximum, Mtexels/sec | Obtained maximum, Mtexels/sec (no texture processing) | Obtained maximum, Mtexels/sec (simple texture processing) |
|---|---|---|---|
| RADEON 9800 PRO | 3000 | 2486 | - |
| GeForce FX 5900 Ultra | 1800 | 1757 | 1739 |
| GeForce FX 5800 Ultra | 2000 | 1957 | 1848 |
Geometry Processing Speed
Now let's take a look at the geometric performance of the graphics adapters. The results are sorted by their difficulty of using the light modeling. Levels' difficulty is growing from Shader Level 1 to Shader Level 7.
Performance of the immobile TCL
[transistor-coupled logic -- logical schemes with transistor coupling] (for NV3x
and R3x0 chips - performance of the shader that it's emulated by):

Let's take a look at the vertex shaders 1.1
now:
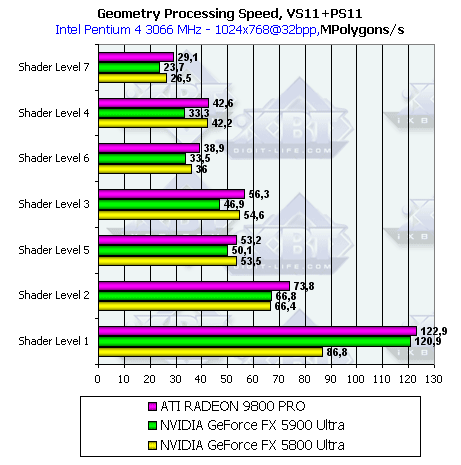
A strange behavior of GeForce FX 5800 Ultra in comparison with GeForce FX 5900 Ultra can be noticed. At the Shader Level 1 the chip shows noticeably lower results than if using the functionally identical settings of the immobile TCL. GeForce FX 5900 Ultra shows comparable results in this testing between vertex shaders 1.1 and the immobile TCL that excludes the possible microcode optimization that could be used.
Vertex Shaders 2.0 with loops is another interesting benchmark.
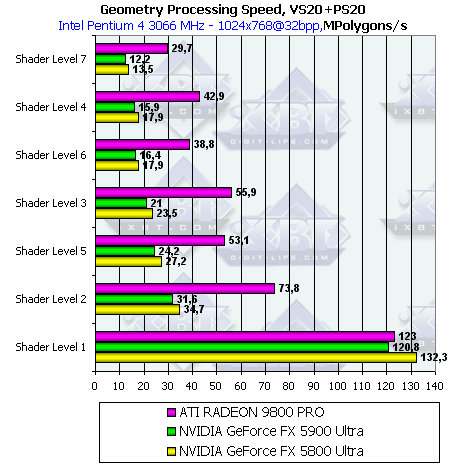
The difference of results of NV30 and NV35 can be explained by their frequencies' difference (450 vs 500 rule works here again !).
ATI Radeon 9800 Pro chip shows strange results in this benchmark. I think that's because of the compilation of shader in the microcode and the following execution of the big shader program.
ATI chip is much better than NV3x chips there because NVIDIA-based ones have to use emulated shaders' compilation for the microcode in this benchmarks. But the whole big shader program is not executed and is replaced by a cycle-based program lauching. That takes much more time and provides a dramatic loss of MPolygons/sec.
If the explanation of the ATI advantage is correct, there also could be some side affects for ATI. The execution of the big shader program takes up more space in the driver's caching memory that could disable all of the ATI-based chips optimizations when, for example, changing the constant, that assigns the quantity of loops (then driver would need to execute the microcode again and then start processing shaders).
The maximum effectiveness of HSR in percentages
(depending on the resolution and triangles quantity), on the no-textures
scene:

Now, the effectiveness of HSR
depending on the scene difficulty:
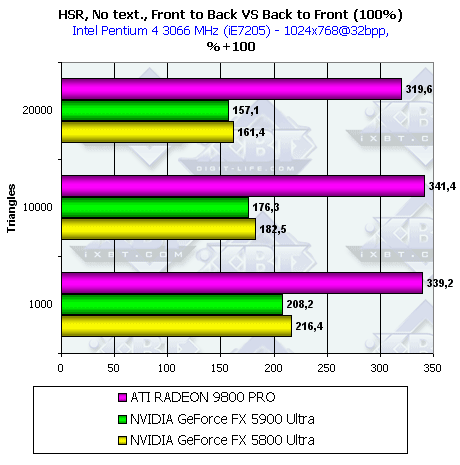
This is actually the first benchmark
of HSR, but the early Z-buffering (depth buffering) is now counted:
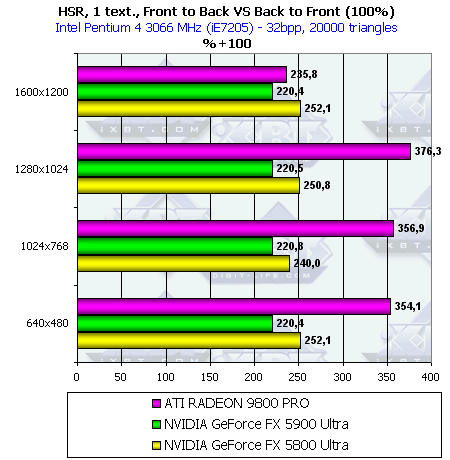

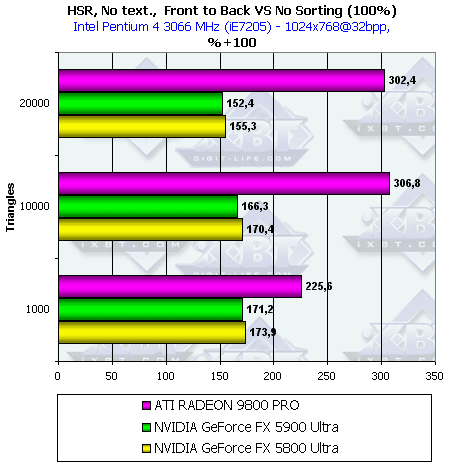

ATI RADEON chip is winning in all of the benchmarks of HSR because of its tall structure. NV3x adapters have only reading method so they lose a dramatic percentage when removing Hidden Surface. At all, NV30 was better than NV35. This could mean that the cut processing-structure for hidden surfaces is used in NV35.
This benchmark illustrates how effective are the new pixel conveyer processors used in NV35 in comparison with NV30.
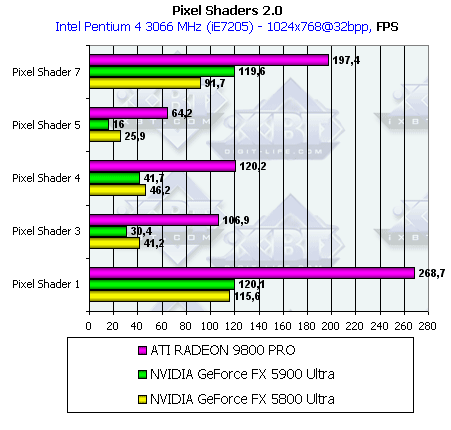
I decided to illustrate the difference (in
percentage) in these benchmarks. As it was declared by NVIDIA, the new
pixel processors used in NV35 are twice more powerful than the ones in
NV30. Don't forget that NV35 frequencies are lower, when looking at the
table:
| Pixel Shader ╣ in the benchmark | 1 | 3 | 4 | 5 | 7 |
|---|---|---|---|---|---|
| GeForce FX 5900 Ultra / 5800 Ultra | +15% | -19% | 0% | -32% | +46% |
To understand why results are so different, let's look inside the RightMark3D (in its program codes). Pixel Shader 1 and 7 use a bigger quantity of a texture fetching. The advantage of NV35 here can be explained by the increased bus bandwidth and optimized caching algorithms.
Radeon 9800 stayed the same, the absolute winner.
Benchmarks results are given with and without lighting depending on the size.
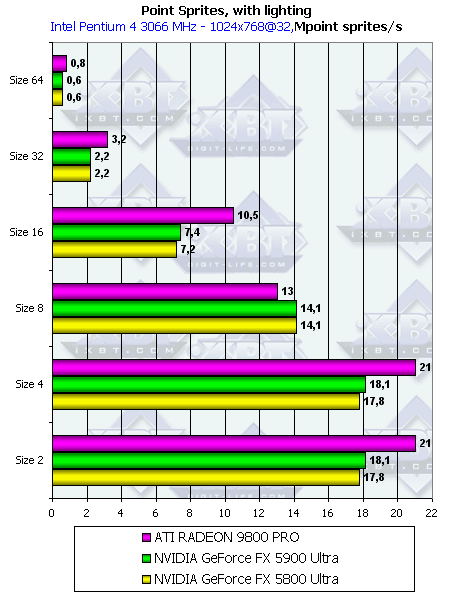
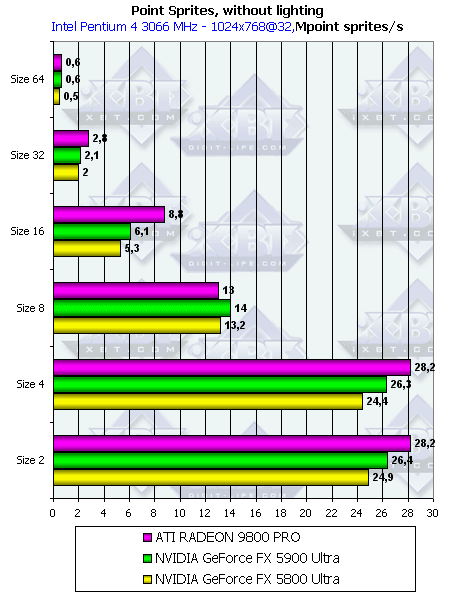
NV35 advantage over NV30 can be explained by the optimization of the frame buffer work in GeForce FX 5900. Size 8 is a special part of the benchmark that allows NVIDIA chips to overpass ATI Radeon. However, ATI chips wins in all of the parts of this benchmark because of having 8 pixel conveyers of rendering (while NV3x adapters have only 4 !).
So the review of 2D Graphics Benchmarks is finished !!!
IF YOU WANT TO KNOW THE RESULTS OF 3D BENCHMARKS !!!
NVIDIA GeForce FX 5900 Ultra (NV35) 3D Benchmarks